
RocketFFL Learning Center
ATF / FFL Statistics Center
How many FFLs, SOTs, and NFA-registered firearms are there, and how often does ATF inspect and revoke licenses? Official ATF data on federal firearms licensees, updated for fiscal year 2025.
License and Inspection Stats
Latest data: FY2025 licenses and inspections, March 2026 state counts, and NFA data through August 2026. Last updated September 24, 2026. Use the table of contents to jump to any section. Each section gives you the raw data, charts, and explanations.
Short answer: There were 127,739 federal firearms licenses (FFLs) in the United States at the end of fiscal year 2025, according to ATF. About 77,755 were business licenses (mostly Type 01 dealers and Type 07 manufacturers), and 49,984 were Type 03 collector licenses. ATF also counted 15,022 NFA special occupational taxpayers (tax year 2023) and completed 8,472 firearms compliance inspections in FY2025, recommending revocation in 83.
Latest data: fiscal year 2025 (Oct. 2024 to Sept. 2025) license and inspection figures from ATF Facts and Figures, FY2025; FFLs by state from the ATF License Type by State report, March 2026; SOT and NFA registry tables from ATF Firearms Commerce in the United States 2024; NFA processing data from ATF Current Processing Times (August 2026). Last updated: September 24, 2026. Next update: when ATF publishes its FY2026 Facts and Figures (usually in the spring) or a new Firearms Commerce report.
Key findings
- There were 127,739 active FFLs at the end of fiscal year 2025 (Sept. 30, 2025), down 0.7% from 128,690 in FY2024 and less than half the 1992 peak of 284,117.
- 77,755 of those were business licenses. The other 49,984 were Type 03 collector licenses, which don't allow a firearms business.
- Type 07 manufacturer licenses keep growing: 21,367 in FY2025, up from 10,498 in FY2015 and 1,773 in FY2000. Type 01 dealer licenses fell to 46,072, the fewest since at least FY1975.
- California (12,291) and Texas (10,407) had the most FFLs in March 2026, but 10,223 of California's are collector licenses. Texas has four times as many business FFLs (8,277 vs 2,068).
- Wyoming has the most FFLs per person (162.4 per 100,000 residents); among the 50 states and D.C., New Jersey (5.3) and D.C. (3.6) have the fewest.
- There were 15,022 special occupational taxpayers (SOTs) in tax year 2023, the latest ATF has published, down from a peak of 17,323 in 2020.
- 8,655,743 weapons were registered under the National Firearms Act as of May 2024, including 3,536,623 silencers. By August 2026 ATF counted 6,654,209 registered silencers.
- ATF processed a record 1,507,443 NFA forms covering 5,817,780 firearms in FY2025. The NFA tax on silencers, SBRs, SBSs, and AOWs dropped to $0 on Jan. 1, 2026, and ATF received 1,874,895 NFA forms in 2026 through Aug. 5.
- ATF completed 8,472 firearms compliance inspections in FY2025. 54.3% found no violations; ATF recommended revocation in 83 (1.0%), down from 195 in FY2024.
Where this data comes from
The data used on this page comes from several ATF sources. The ATF publishes data on the commerce of firearms, which includes much of this data about the firearms industry. However, some of those reports are delayed by at least two years so as not to give a competitive advantage to any particular company. Some of this data is gathered from ATF's published Fact Sheets and the National Firearms Commerce and Trafficking Assessment (NFCTA).
To gather this information, the ATF relies on its own figures from the ATF licensing center, the National Firearms Act division, and its industry operations inspections, and also on the annually required Annual Firearms Manufacturing and Exportation Report (AFMER) from manufacturer FFLs. (For manufacturing numbers, see our U.S. firearms industry statistics page.)
We gather, organize, and publish this data as an industry leader in the FFL space. To date, we've helped over 20,000 FFLs. We were founded by, and our courses have been created and are taught by, Ryan Cleckner, a firearms attorney who specializes in federal firearms law and ATF compliance, a bestselling author, firearms industry executive, and former special operations sniper and university professor.
GUIDE INDEX
Table of Contents
Key findings
1. Federal Firearms Licenses (FFLs)
Total Number of Licenses
Number of FFLs by Type
Number of FFLs by State
FFLs per Capita by State
FFL Applications & Processing Times
2. Special Occupational Taxpayers (SOTs)
3. NFA Registered Weapons & Forms
4. ATF Inspections
Methodology
Sources & CSV Downloads
Cite This Page
FAQ
1. Federal Firearms Licenses (FFLs)
A federal firearms license, or FFL, is a license issued by the Bureau of Alcohol, Tobacco, Firearms, and Explosives (ATF) that allows the holder of the license to engage in business concerning firearms.
The type of business activity allowed depends on the type of FFL. For example, a Type 01 FFL, the most common type of business FFL, allows for dealing in firearms (a gun shop) and gunsmithing. The second most common type of business FFL, the Type 07 FFL, allows for the manufacturing of firearms and also dealing.
In this section, we display the data for the total number of FFLs, the number of FFLs by license type, the number of FFLs by state (including per capita), and how long FFL applications take.
Total Number of Licenses
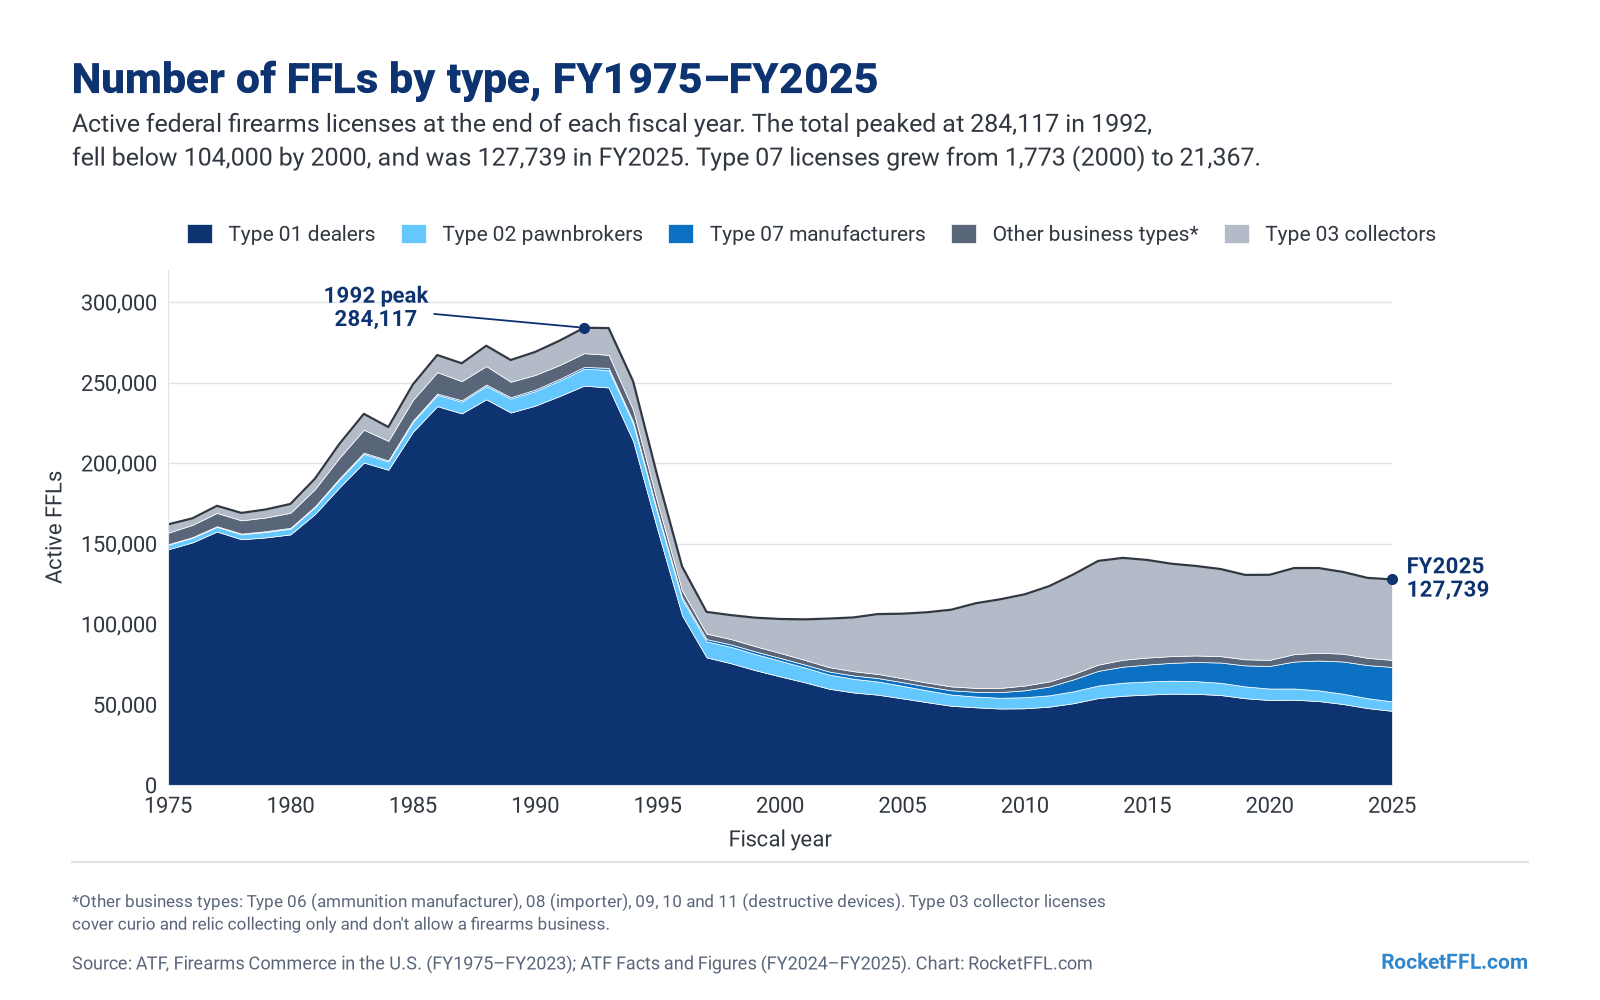
The total number of FFLs in this country has stayed above 100,000 for the past 30 years. After bottoming out at 102,913 in FY2001, it climbed steadily through the 2000s to a high of 141,116 in FY2014, and there were 127,739 FFLs at the end of FY2025.
As you can see in the chart and table below, the number of FFLs reached an all-time high of 284,117 in 1992 and then dropped sharply through the late 1990s.
This large drop was due to the Clinton administration's efforts to shut down "kitchen-table" or home-based FFLs. Since then, however, home-based FFLs are not only permitted, they are incredibly popular and make up the majority of FFLs in the country today.
Read the full guide: How to Get a Home Based FFL →
| Fiscal year | Active FFLs | Business FFLs (excl. Type 03) | Type 03 collectors |
|---|---|---|---|
| 2025 | 127,739 | 77,755 | 49,984 |
| 2024 | 128,690 | 79,001 | 49,689 |
| 2023 | 132,383 | 81,578 | 50,805 |
| 2022 | 134,811 | 82,203 | 52,608 |
| 2021 | 134,809 | 81,334 | 53,475 |
| 2020 | 130,605 | 77,740 | 52,865 |
| 2015 | 139,840 | 79,188 | 60,652 |
| 2014 | 141,116 | 77,815 | 63,301 |
| 2010 | 118,487 | 61,807 | 56,680 |
| 2005 | 106,432 | 66,359 | 40,073 |
| 2001 (low) | 102,913 | 77,768 | 25,145 |
| 2000 | 103,157 | 82,057 | 21,100 |
| 1995 | 191,495 | 175,141 | 16,354 |
| 1992 (peak) | 284,117 | 268,297 | 15,820 |
| 1990 | 269,079 | 254,792 | 14,287 |
| 1985 | 248,794 | 239,195 | 9,599 |
| 1980 | 174,619 | 169,138 | 5,481 |
| 1975 | 161,927 | 156,716 | 5,211 |
Active federal firearms licenses at the end of selected fiscal years (ATF fiscal years end Sept. 30). Sources: ATF Firearms Commerce in the United States, Annual Statistical Updates 2021 and 2024 (FY1975–FY2023); ATF Facts and Figures FY2024 and FY2025. Every year is in the raw data table below and in the CSV download.
Number of FFLs per Year (raw data)
| Year | Number of FFLs |
|---|---|
| 1975 | 161,927 |
| 1976 | 165,697 |
| 1977 | 173,484 |
| 1978 | 169,052 |
| 1979 | 171,216 |
| 1980 | 174,619 |
| 1981 | 190,296 |
| 1982 | 211,918 |
| 1983 | 230,613 |
| 1984 | 222,443 |
| 1985 | 248,794 |
| 1986 | 267,166 |
| 1987 | 262,022 |
| 1988 | 272,953 |
| 1989 | 264,063 |
| 1990 | 269,079 |
| 1991 | 276,116 |
| 1992 | 284,117 |
| 1993 | 283,925 |
| 1994 | 250,833 |
| 1995 | 191,495 |
| 1996 | 135,794 |
| 1997 | 107,554 |
| 1998 | 105,536 |
| 1999 | 103,942 |
| 2000 | 103,157 |
| 2001 | 102,913 |
| 2002 | 103,411 |
| 2003 | 104,105 |
| 2004 | 106,214 |
| 2005 | 106,432 |
| 2006 | 107,316 |
| 2007 | 108,933 |
| 2008 | 112,943 |
| 2009 | 115,395 |
| 2010 | 118,487 |
| 2011 | 123,587 |
| 2012 | 130,956 |
| 2013 | 139,244 |
| 2014 | 141,116 |
| 2015 | 139,840 |
| 2016 | 137,464 |
| 2017 | 136,081 |
| 2018 | 134,191 |
| 2019 | 130,546 |
| 2020 | 130,605 |
| 2021 | 134,809 |
| 2022 | 134,811 |
| 2023 | 132,383 |
| 2024 | 128,690 |
| 2025 | 127,739 |
Number of FFLs by Type
The distribution of licenses by type changes slowly year over year. Type 01 FFLs are the most popular business FFLs and Type 07 FFLs are the second most popular business FFLs.
It is most accurate to point out that the most common type of FFL is actually the Type 03 Collector's FFL. However, that is not a business FFL and does NOT allow the holder to engage in business with firearms (buying, selling, making, etc.). Instead, it only allows for the collecting of "curio and relic" firearms. Even though there are more Type 03 FFLs than any other, they are largely ignored for our purposes because, even though they are technically an "FFL," they should really be called a "collector's license," and they do not affect the firearms industry.
To that end, we show the breakdown of licenses by type for the most recent year in the table below and then include the totals of FFLs by type over the years as raw data.
There are 9 Types of FFLs:
- Type 01 FFL - Dealers and Gunsmiths
- Type 02 FFL - Pawnbrokers
- Type 03 FFL - Collectors of Curios and Relics
- Type 06 FFL - Manufacturer of Ammunition
- Type 07 FFL - Manufacturer of Firearms
- Type 08 FFL - Importer of Firearms
- Type 09 FFL - Dealer of Destructive Devices
- Type 10 FFL - Manufacturer of Destructive Devices
- Type 11 FFL - Importer of Destructive Devices
| Type | License | FY2025 | Share of all FFLs | FY2024 | Change |
|---|---|---|---|---|---|
| 01 | Dealer / gunsmith | 46,072 | 36.1% | 47,776 | −3.6% |
| 02 | Pawnbroker | 5,929 | 4.6% | 6,149 | −3.6% |
| 03 | Collector of curios & relics | 49,984 | 39.1% | 49,689 | +0.6% |
| 06 | Ammunition manufacturer | 1,748 | 1.4% | 1,858 | −5.9% |
| 07 | Firearms manufacturer | 21,367 | 16.7% | 20,578 | +3.8% |
| 08 | Importer | 1,678 | 1.3% | 1,698 | −1.2% |
| 09 | Destructive device dealer | 137 | 0.1% | 145 | −5.5% |
| 10 | Destructive device manufacturer | 522 | 0.4% | 496 | +5.2% |
| 11 | Destructive device importer | 302 | 0.2% | 301 | +0.3% |
| Total | 127,739 | 100% | 128,690 | −0.7% |
Active FFLs by license type at the end of FY2025 (Sept. 30, 2025) and FY2024. ATF issued 41,931 licenses (including renewals) in FY2025 and 43,956 in FY2024. Sources: ATF Facts and Figures, FY2025 and FY2024.
As you can see in the chart above, although the ranking of FFL types hasn't changed much over the years, the number of Type 01 and Type 03 FFLs has decreased while the number of Type 07 FFLs has increased.
We hope that we've had some influence on that because in our Get Your FFL course, we recommend getting a Type 07 FFL when possible because it is not only cheaper than a Type 01 Dealer's FFL for the first three years ($150 vs $200, go figure), it also allows everything a Type 01 FFL allows plus manufacturing.
| Fiscal year | Type 01 dealers | Type 03 collectors | Type 07 manufacturers | Type 07 share of business FFLs |
|---|---|---|---|---|
| 2025 | 46,072 | 49,984 | 21,367 | 27.5% |
| 2024 | 47,776 | 49,689 | 20,578 | 26.0% |
| 2023 | 50,309 | 50,805 | 20,003 | 24.5% |
| 2022 | 52,173 | 52,608 | 18,517 | 22.5% |
| 2021 | 52,993 | 53,475 | 16,730 | 20.6% |
| 2020 | 52,799 | 52,865 | 14,054 | 18.1% |
| 2015 | 56,181 | 60,652 | 10,498 | 13.3% |
| 2010 | 47,664 | 56,680 | 4,293 | 6.9% |
| 2005 | 53,833 | 40,073 | 2,272 | 3.4% |
| 2000 | 67,479 | 21,100 | 1,773 | 2.2% |
Type 01, 03, and 07 licenses at the end of selected fiscal years. Business FFLs = all types except Type 03. Sources: ATF Firearms Commerce in the United States (FY2000–FY2023); ATF Facts and Figures (FY2024–FY2025). Interactive chart (Google Sheets)
FFL Types by Year (raw data)
| Year | Type 1 | Type 2 | Type 3 | Type 6 | Type 7 | Type 8 | Type 9 | Type 10 | Type 11 |
|---|---|---|---|---|---|---|---|---|---|
| 2013 | 54,026 | 7,810 | 64,449 | 2,353 | 9,094 | 998 | 57 | 273 | 184 |
| 2014 | 55,431 | 8,132 | 63,301 | 2,596 | 9,970 | 1,133 | 66 | 287 | 200 |
| 2015 | 56,181 | 8,152 | 60,652 | 2,603 | 10,498 | 1,152 | 66 | 315 | 221 |
| 2016 | 56,754 | 8,076 | 57,345 | 2,481 | 11,083 | 1,105 | 71 | 332 | 217 |
| 2017 | 56,638 | 7,871 | 55,588 | 2,259 | 11,946 | 1,110 | 78 | 357 | 234 |
| 2018 | 55,891 | 7,639 | 54,136 | 2,119 | 12,564 | 1,127 | 98 | 378 | 239 |
| 2019 | 53,924 | 7,341 | 52,446 | 1,910 | 13,044 | 1,109 | 129 | 391 | 252 |
| 2020 | 52,799 | 7,141 | 52,865 | 1,797 | 14,054 | 1,127 | 128 | 425 | 269 |
| 2021 | 52,993 | 6,981 | 53,475 | 2,111 | 16,730 | 1,632 | 141 | 462 | 284 |
| 2022 | 52,173 | 6,666 | 52,608 | 2,123 | 18,517 | 1,809 | 141 | 475 | 299 |
| 2023 | 50,309 | 6,417 | 50,805 | 2,086 | 20,003 | 1,851 | 147 | 476 | 289 |
| 2024 | 47,776 | 6,149 | 49,689 | 1,858 | 20,578 | 1,698 | 145 | 496 | 301 |
| 2025 | 46,072 | 5,929 | 49,984 | 1,748 | 21,367 | 1,678 | 137 | 522 | 302 |
Number of FFLs by State
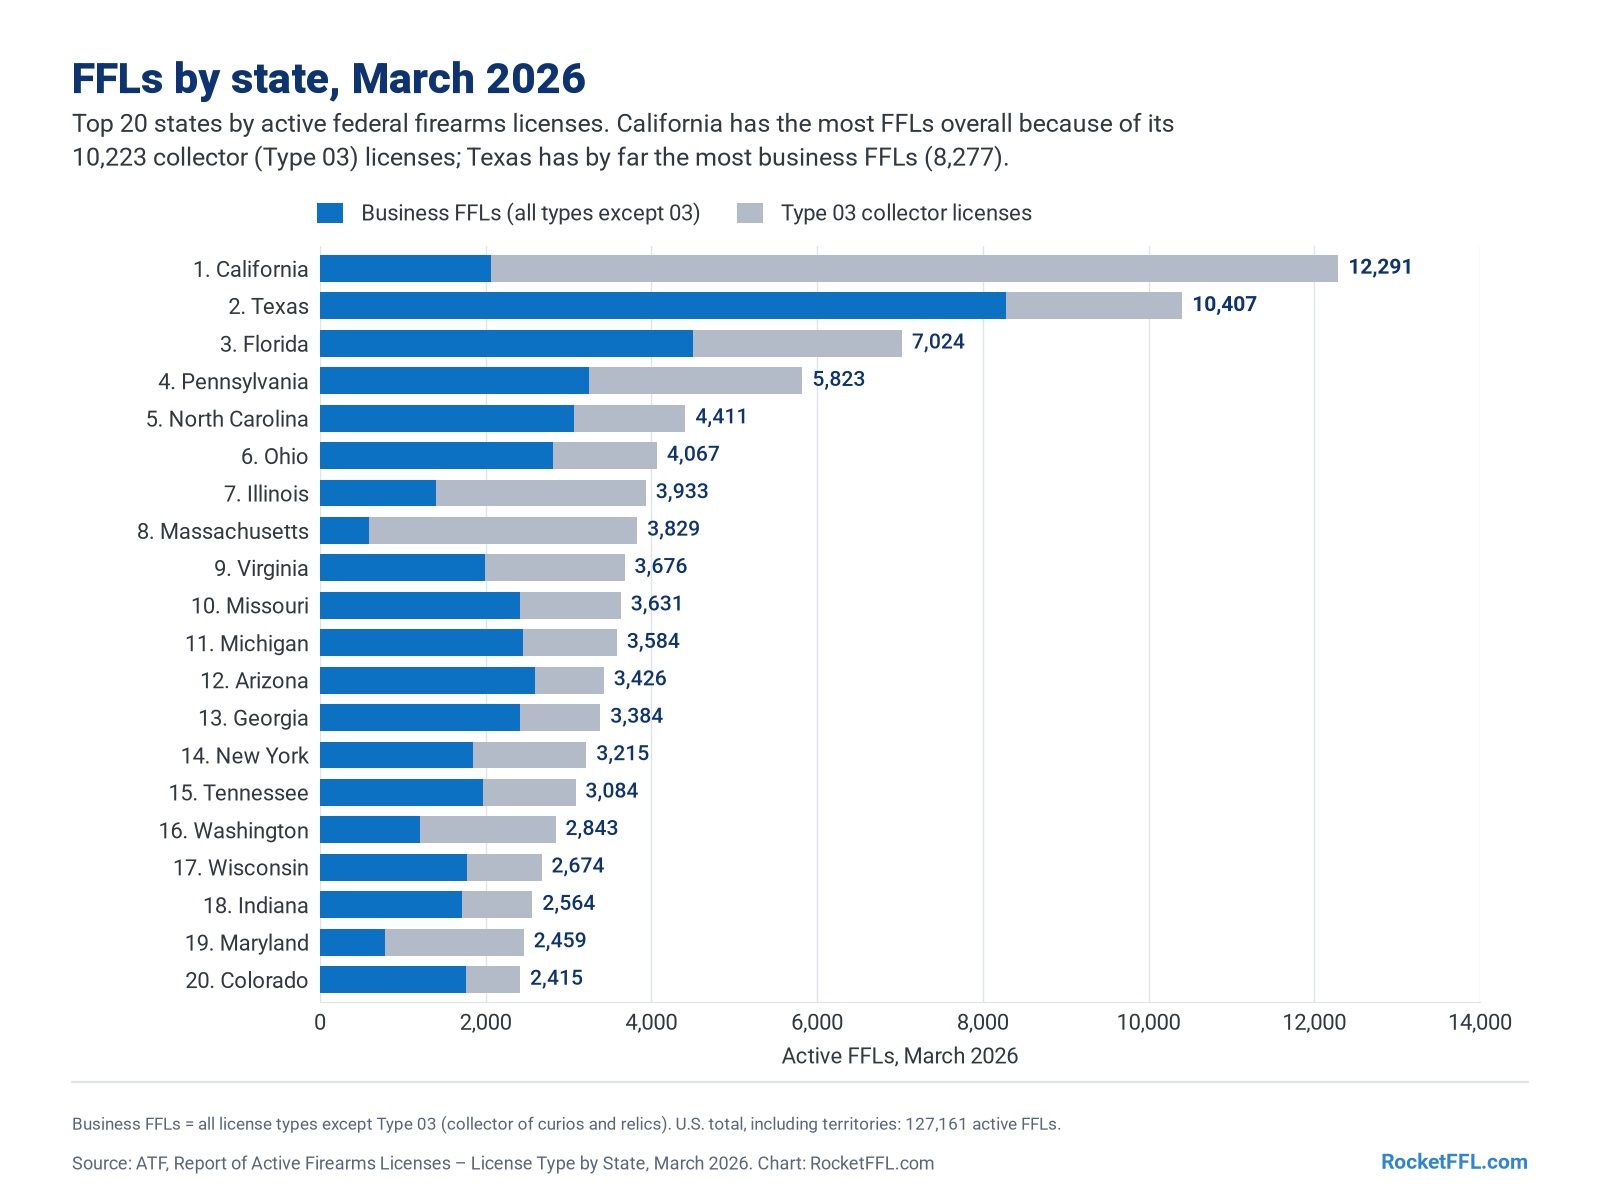
The number of FFLs in each state may surprise you. For being largely "anti-gun," the state of California now has the most FFLs of any state (12,291), ahead of Texas (10,407). In ATF's FY2023 counts, Texas was still first (11,109 vs 9,815).
But the reason is collector licenses: 10,223 of California's FFLs (83%) are Type 03 collector licenses. California requires most gun buyers to go through a dealer and wait, and a Type 03 license (together with a state Certificate of Eligibility) can exempt collectors from some of those rules for curio and relic firearms. Count only business FFLs and Texas leads by a mile, with 8,277 to California's 2,068.
The table below lists the 20 states with the most FFLs in ATF's March 2026 report, the most recent month ATF has published. The full 50-state table (with per-capita rates) follows in the next section.
| Rank | State | Total FFLs | Business FFLs (excl. Type 03) | Type 03 collectors | Type 01 | Type 07 | FY2023 total |
|---|---|---|---|---|---|---|---|
| 1 | California | 12,291 | 2,068 | 10,223 | 1,249 | 583 | 9,815 |
| 2 | Texas | 10,407 | 8,277 | 2,130 | 4,217 | 2,634 | 11,109 |
| 3 | Florida | 7,024 | 4,499 | 2,525 | 2,079 | 1,445 | 7,429 |
| 4 | Pennsylvania | 5,823 | 3,244 | 2,579 | 2,238 | 781 | 6,199 |
| 5 | North Carolina | 4,411 | 3,068 | 1,343 | 1,716 | 905 | 4,621 |
| 6 | Ohio | 4,067 | 2,813 | 1,254 | 1,721 | 827 | 4,234 |
| 7 | Illinois | 3,933 | 1,406 | 2,527 | 987 | 294 | 4,337 |
| 8 | Massachusetts | 3,829 | 595 | 3,234 | 265 | 300 | 3,884 |
| 9 | Virginia | 3,676 | 1,996 | 1,680 | 1,231 | 472 | 3,980 |
| 10 | Missouri | 3,631 | 2,409 | 1,222 | 1,565 | 540 | 3,873 |
| 11 | Michigan | 3,584 | 2,444 | 1,140 | 1,665 | 578 | 3,761 |
| 12 | Arizona | 3,426 | 2,597 | 829 | 1,129 | 1,137 | 3,619 |
| 13 | Georgia | 3,384 | 2,417 | 967 | 1,197 | 663 | 3,601 |
| 14 | New York | 3,215 | 1,846 | 1,369 | 1,386 | 368 | 3,739 |
| 15 | Tennessee | 3,084 | 1,966 | 1,118 | 1,073 | 602 | 3,205 |
| 16 | Washington | 2,843 | 1,208 | 1,635 | 649 | 394 | 3,228 |
| 17 | Wisconsin | 2,674 | 1,774 | 900 | 1,196 | 458 | 2,802 |
| 18 | Indiana | 2,564 | 1,715 | 849 | 1,145 | 422 | 2,650 |
| 19 | Maryland | 2,459 | 788 | 1,671 | 509 | 198 | 2,773 |
| 20 | Colorado | 2,415 | 1,758 | 657 | 997 | 559 | 3,023 |
Top 20 states by active FFLs, March 2026. U.S. total including territories: 127,161 active licenses, plus 1,480 pending applications that ATF lists separately. Sources: ATF, Report of Active Firearms Licenses – License Type by State Statistics, March 2026 (print date March 10, 2026); FY2023: ATF Firearms Commerce in the United States 2024, Exhibit 13.
FFLs per Capita by State
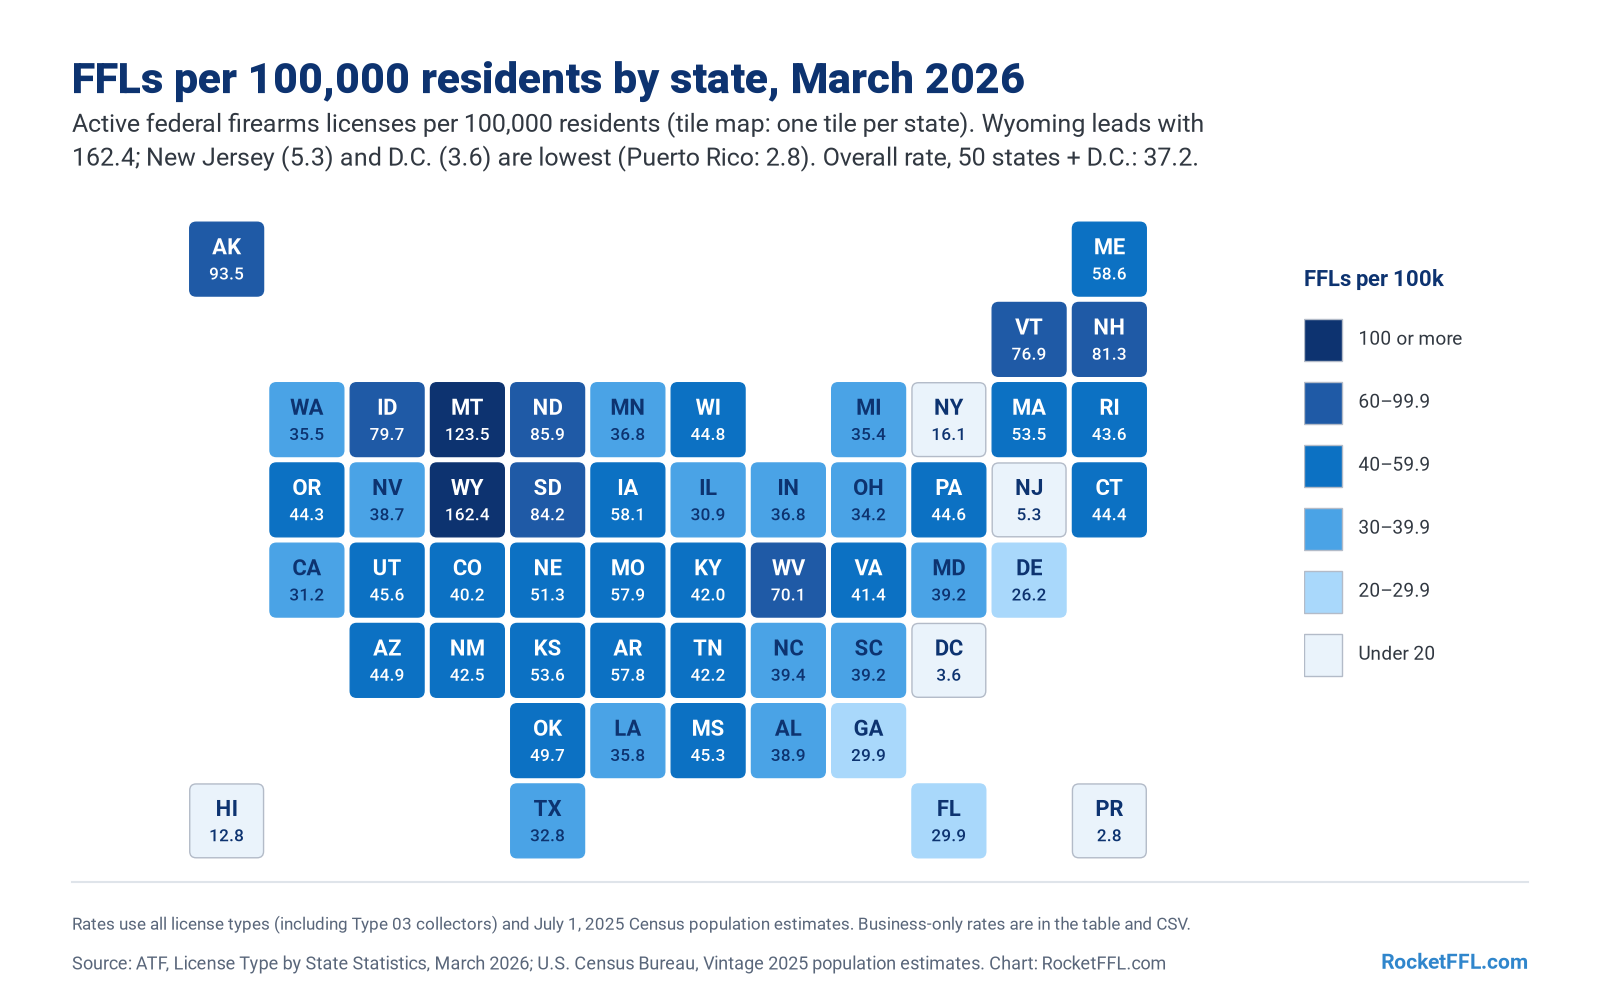
Raw counts mostly track population, so we also divided each state's March 2026 FFL count by its July 1, 2025 population from the U.S. Census Bureau. Across the 50 states and D.C., there were 37.2 FFLs per 100,000 residents.
Wyoming (162.4), Montana (123.5), Alaska (93.5), North Dakota (85.9), and South Dakota (84.2) have the most FFLs per person. New York (16.1), Hawaii (12.8), New Jersey (5.3), and D.C. (3.6) have the fewest (Puerto Rico: 2.8). Counting business licenses only, California drops to 5.3 per 100,000, near the bottom with New Jersey (3.9) and D.C. (0.6).
| State | Total FFLs | Business FFLs | Type 03 | FFLs per 100k residents | Business FFLs per 100k | Pending applications |
|---|---|---|---|---|---|---|
| Alabama | 2,018 | 1,486 | 532 | 38.9 | 28.6 | 15 |
| Alaska | 689 | 561 | 128 | 93.5 | 76.1 | 9 |
| Arizona | 3,426 | 2,597 | 829 | 44.9 | 34.1 | 47 |
| Arkansas | 1,801 | 1,479 | 322 | 57.8 | 47.5 | 21 |
| California | 12,291 | 2,068 | 10,223 | 31.2 | 5.3 | 120 |
| Colorado | 2,415 | 1,758 | 657 | 40.2 | 29.2 | 31 |
| Connecticut | 1,636 | 651 | 985 | 44.4 | 17.6 | 8 |
| Delaware | 278 | 135 | 143 | 26.2 | 12.7 | 2 |
| District of Columbia | 25 | 4 | 21 | 3.6 | 0.6 | 0 |
| Florida | 7,024 | 4,499 | 2,525 | 29.9 | 19.2 | 78 |
| Georgia | 3,384 | 2,417 | 967 | 29.9 | 21.4 | 27 |
| Guam | 17 | 16 | 1 | n/a | n/a | 0 |
| Hawaii | 183 | 104 | 79 | 12.8 | 7.3 | 0 |
| Idaho | 1,617 | 1,322 | 295 | 79.7 | 65.1 | 19 |
| Illinois | 3,933 | 1,406 | 2,527 | 30.9 | 11.1 | 24 |
| Indiana | 2,564 | 1,715 | 849 | 36.8 | 24.6 | 41 |
| Iowa | 1,881 | 1,431 | 450 | 58.1 | 44.2 | 26 |
| Kansas | 1,597 | 1,228 | 369 | 53.6 | 41.2 | 18 |
| Kentucky | 1,937 | 1,440 | 497 | 42.0 | 31.3 | 23 |
| Louisiana | 1,655 | 1,289 | 366 | 35.8 | 27.9 | 41 |
| Maine | 829 | 543 | 286 | 58.6 | 38.4 | 9 |
| Maryland | 2,459 | 788 | 1,671 | 39.2 | 12.6 | 20 |
| Massachusetts | 3,829 | 595 | 3,234 | 53.5 | 8.3 | 17 |
| Michigan | 3,584 | 2,444 | 1,140 | 35.4 | 24.1 | 52 |
| Minnesota | 2,143 | 1,544 | 599 | 36.8 | 26.5 | 24 |
| Mississippi | 1,338 | 1,046 | 292 | 45.3 | 35.4 | 17 |
| Missouri | 3,631 | 2,409 | 1,222 | 57.9 | 38.4 | 51 |
| Montana | 1,414 | 1,175 | 239 | 123.5 | 102.6 | 22 |
| Nebraska | 1,036 | 802 | 234 | 51.3 | 39.7 | 18 |
| Nevada | 1,270 | 860 | 410 | 38.7 | 26.2 | 17 |
| New Hampshire | 1,150 | 612 | 538 | 81.3 | 43.2 | 5 |
| New Jersey | 506 | 377 | 129 | 5.3 | 3.9 | 6 |
| New Mexico | 903 | 689 | 214 | 42.5 | 32.4 | 10 |
| New York | 3,215 | 1,846 | 1,369 | 16.1 | 9.2 | 22 |
| North Carolina | 4,411 | 3,068 | 1,343 | 39.4 | 27.4 | 56 |
| North Dakota | 687 | 534 | 153 | 85.9 | 66.8 | 9 |
| Northern Mariana Islands | 5 | 5 | 0 | n/a | n/a | 0 |
| Ohio | 4,067 | 2,813 | 1,254 | 34.2 | 23.6 | 33 |
| Oklahoma | 2,051 | 1,695 | 356 | 49.7 | 41.1 | 18 |
| Oregon | 1,894 | 1,374 | 520 | 44.3 | 32.2 | 32 |
| Pennsylvania | 5,823 | 3,244 | 2,579 | 44.6 | 24.8 | 51 |
| Puerto Rico | 90 | 73 | 17 | 2.8 | 2.3 | 0 |
| Rhode Island | 486 | 113 | 373 | 43.6 | 10.1 | 0 |
| South Carolina | 2,183 | 1,491 | 692 | 39.2 | 26.8 | 44 |
| South Dakota | 787 | 641 | 146 | 84.2 | 68.5 | 11 |
| Tennessee | 3,084 | 1,966 | 1,118 | 42.2 | 26.9 | 51 |
| Texas | 10,407 | 8,277 | 2,130 | 32.8 | 26.1 | 152 |
| U.S. Virgin Islands | 13 | 12 | 1 | n/a | n/a | 0 |
| Utah | 1,612 | 1,369 | 243 | 45.6 | 38.7 | 21 |
| Vermont | 496 | 347 | 149 | 76.9 | 53.8 | 7 |
| Virginia | 3,676 | 1,996 | 1,680 | 41.4 | 22.5 | 60 |
| Washington | 2,843 | 1,208 | 1,635 | 35.5 | 15.1 | 37 |
| West Virginia | 1,238 | 965 | 273 | 70.1 | 54.6 | 10 |
| Wisconsin | 2,674 | 1,774 | 900 | 44.8 | 29.7 | 29 |
| Wyoming | 956 | 816 | 140 | 162.4 | 138.6 | 19 |
| Total | 127,161 | 77,117 | 50,044 | 37.2 (50 states + D.C.) | 1,480 |
Active FFLs by state and territory, March 2026, with rates per 100,000 residents. Per-capita rates are calculated by RocketFFL; ATF doesn't publish them, and they aren't calculated for territories without a Census estimate in the same file. Sources: ATF, License Type by State Statistics, March 2026; U.S. Census Bureau, Vintage 2025 Population Estimates (NST-EST2025-ALLDATA). CSV download (all license types by state).
Number of FFLs by State, FY2021–FY2023 (raw data)
The raw data table below shows ATF's fiscal-year state totals for FY2021–FY2023 (ATF Firearms Commerce in the United States 2024, Exhibit 13). The March 2026 counts above are newer.
| State | 2021 | 2022 | 2023 |
|---|---|---|---|
| Alabama | 2180 | 2159 | 2073 |
| Alaska | 827 | 810 | 758 |
| Arizona | 3,629 | 3,679 | 3,619 |
| Arkansas | 1,884 | 1,878 | 1,871 |
| California | 9,128 | 9,561 | 9,815 |
| Colorado | 3,067 | 3,042 | 3,023 |
| Connecticut | 1,780 | 1,763 | 1,716 |
| Delaware | 323 | 321 | 309 |
| District of Columbia | 35 | 31 | 24 |
| Florida | 7,364 | 7,504 | 7,429 |
| Georgia | 3,649 | 3,703 | 3,601 |
| Hawaii | 232 | 231 | 219 |
| Idaho | 1,593 | 1,647 | 1,672 |
| Illinois | 4,432 | 4,266 | 4,337 |
| Indiana | 2,741 | 2,716 | 2,650 |
| Iowa | 2,048 | 2,025 | 1,968 |
| Kansas | 1,817 | 1,786 | 1,729 |
| Kentucky | 2,246 | 2,213 | 2,168 |
| Louisiana | 1,931 | 1,887 | 1,800 |
| Maine | 914 | 919 | 884 |
| Maryland | 2,891 | 2,903 | 2,773 |
| Massachusetts | 3,975 | 3,963 | 3,884 |
| Michigan | 3,921 | 3,887 | 3,761 |
| Minnesota | 2,436 | 2,379 | 2,319 |
| Mississippi | 1,461 | 1,456 | 1,383 |
| Missouri | 4,181 | 4,035 | 3,873 |
| Montana | 1,500 | 1,503 | 1,478 |
| Nebraska | 1,102 | 1,113 | 1,075 |
| Nevada | 1,353 | 1,334 | 1,311 |
| New Hampshire | 1,200 | 1,201 | 1,187 |
| New Jersey | 470 | 491 | 511 |
| New Mexico | 1,052 | 1,010 | 993 |
| New York | 3,922 | 3,905 | 3,739 |
| North Carolina | 4,611 | 4,661 | 4,621 |
| North Dakota | 718 | 707 | 695 |
| Ohio | 4,575 | 4,413 | 4,234 |
| Oklahoma | 2,251 | 2,195 | 2,112 |
| Oregon | 2,181 | 2,123 | 2,046 |
| Pennsylvania | 6,288 | 6,332 | 6,199 |
| Rhode Island | 566 | 559 | 565 |
| South Carolina | 2,226 | 2,235 | 2,247 |
| South Dakota | 784 | 800 | 793 |
| Tennessee | 3,186 | 3,197 | 3,205 |
| Texas | 11,301 | 11,378 | 11,109 |
| Utah | 1,634 | 1,688 | 1,700 |
| Vermont | 551 | 541 | 529 |
| Virginia | 4,137 | 4,078 | 3,980 |
| Washington | 3,279 | 3,316 | 3,228 |
| West Virginia | 1,362 | 1,363 | 1,318 |
| Wisconsin | 2,837 | 2,846 | 2,802 |
| Wyoming | 913 | 934 | 927 |
| Other Territories | 125 | 124 | 121 |
| 134809 | 134,811 | 132,383 |
FFL Applications & Processing Times
New FFL applicants file ATF Form 7 (5310.12) with the Federal Firearms Licensing Center, and an ATF industry operations investigator usually interviews the applicant before the license is approved. For applications finalized in July 2026, ATF reported an average of 60 days to process a Form 7 FFL application (ATF Current Processing Times). ATF doesn't publish a median or a range for Form 7.
In FY2025, ATF conducted 8,562 firearms application inspections: 6,347 were approved, only 14 were denied, and 2,201 were abandoned or withdrawn. Denials are rare. Far more applications end because the applicant withdraws or stops responding, which is usually a sign they weren't ready for the interview or zoning and business requirements. That's exactly what our course helps you prepare for.
| Fiscal year | Application inspections | Approved | Denied | Abandoned or withdrawn | Original applications processed (Commerce) | Denied (Commerce) |
|---|---|---|---|---|---|---|
| 2025 | 8,562 | 6,347 | 14 | 2,201 | n/a | n/a |
| 2024 | 8,815 | 6,395 | 37 | 2,383 | n/a | n/a |
| 2023 | 9,328 | 6,769 | 25 | 2,534 | 10,624 | 26 |
| 2022 | n/a | n/a | n/a | n/a | 11,610 | 30 |
| 2021 | 15,181 | 10,545 | 20 | 4,616 | 13,197 | 8 |
| 2020 | n/a | n/a | n/a | n/a | 13,429 | 11 |
| 2015 | n/a | n/a | n/a | n/a | 15,219 | 34 |
Firearms license application actions. Application inspections: ATF Facts and Figures (FY2021, FY2023–FY2025; ATF's FY2022 figure wasn't available to us). Original applications processed and denied: ATF Firearms Commerce in the United States 2024, Exhibit 14 (through FY2023). n/a = not published in these sources. CSV download (FY1975–FY2025).
GET YOUR FFL COURSE
Want Help Getting Your Own FFL (the right way)?
Follow a step-by-step roadmap designed to help you make the right decisions, prepare for the ATF interview, and move forward with confidence.
- Attorney-created
- Lifetime access
- Updated as things change
2. Special Occupational Taxpayers (SOTs)
A special occupational taxpayer (SOT) is an FFL that has also paid the National Firearms Act special occupational tax so it can import (Class 1), manufacture (Class 2), or deal in (Class 3) NFA firearms such as machineguns, short-barreled rifles and shotguns, silencers, and destructive devices. You need the right FFL first: a Type 08 or 11 for Class 1, a Type 07 or 10 for Class 2, and a Type 01, 02, or 09 for Class 3 (or pair a manufacturer or importer license with the matching SOT class).
The SOT is paid each year by July 1 and runs on a July-to-June tax year. It is $1,000 per year per location for importers and manufacturers ($500 for qualifying small businesses with gross receipts under $500,000) and $500 per location for dealers. The 2026 change that dropped the NFA making and transfer tax to $0 did not change the special occupational tax.
Number of SOTs by Class
| Tax year | Class 1 importers | Class 2 manufacturers | Class 3 dealers | Total SOTs |
|---|---|---|---|---|
| 2023 | 316 | 7,146 | 7,560 | 15,022 |
| 2020 | 476 | 6,310 | 10,537 | 17,323 |
| 2019 | 470 | 5,716 | 7,806 | 13,992 |
| 2018 | 438 | 5,402 | 6,620 | 12,460 |
| 2017 | 439 | 5,078 | 6,252 | 11,769 |
| 2016 | 424 | 4,543 | 5,546 | 10,513 |
| 2015 | 396 | 4,156 | 4,797 | 9,349 |
| 2014 | 366 | 3,715 | 4,135 | 8,216 |
| 2013 | 258 | 3,020 | 3,569 | 6,847 |
| 2012 | 242 | 2,383 | 2,973 | 5,598 |
| 2011 | 238 | 1,963 | 2,528 | 4,729 |
| 2010 | 219 | 1,749 | 2,312 | 4,280 |
| 2021–2022 | not published | not published | not published | not published |
NFA special occupational taxpayers by class and tax year. ATF notes the counts may include multiple locations per taxpayer. ATF has not published tax years 2021 or 2022. Sources: ATF Firearms Commerce in the United States, Annual Statistical Updates 2011–2021 and 2024. CSV download.
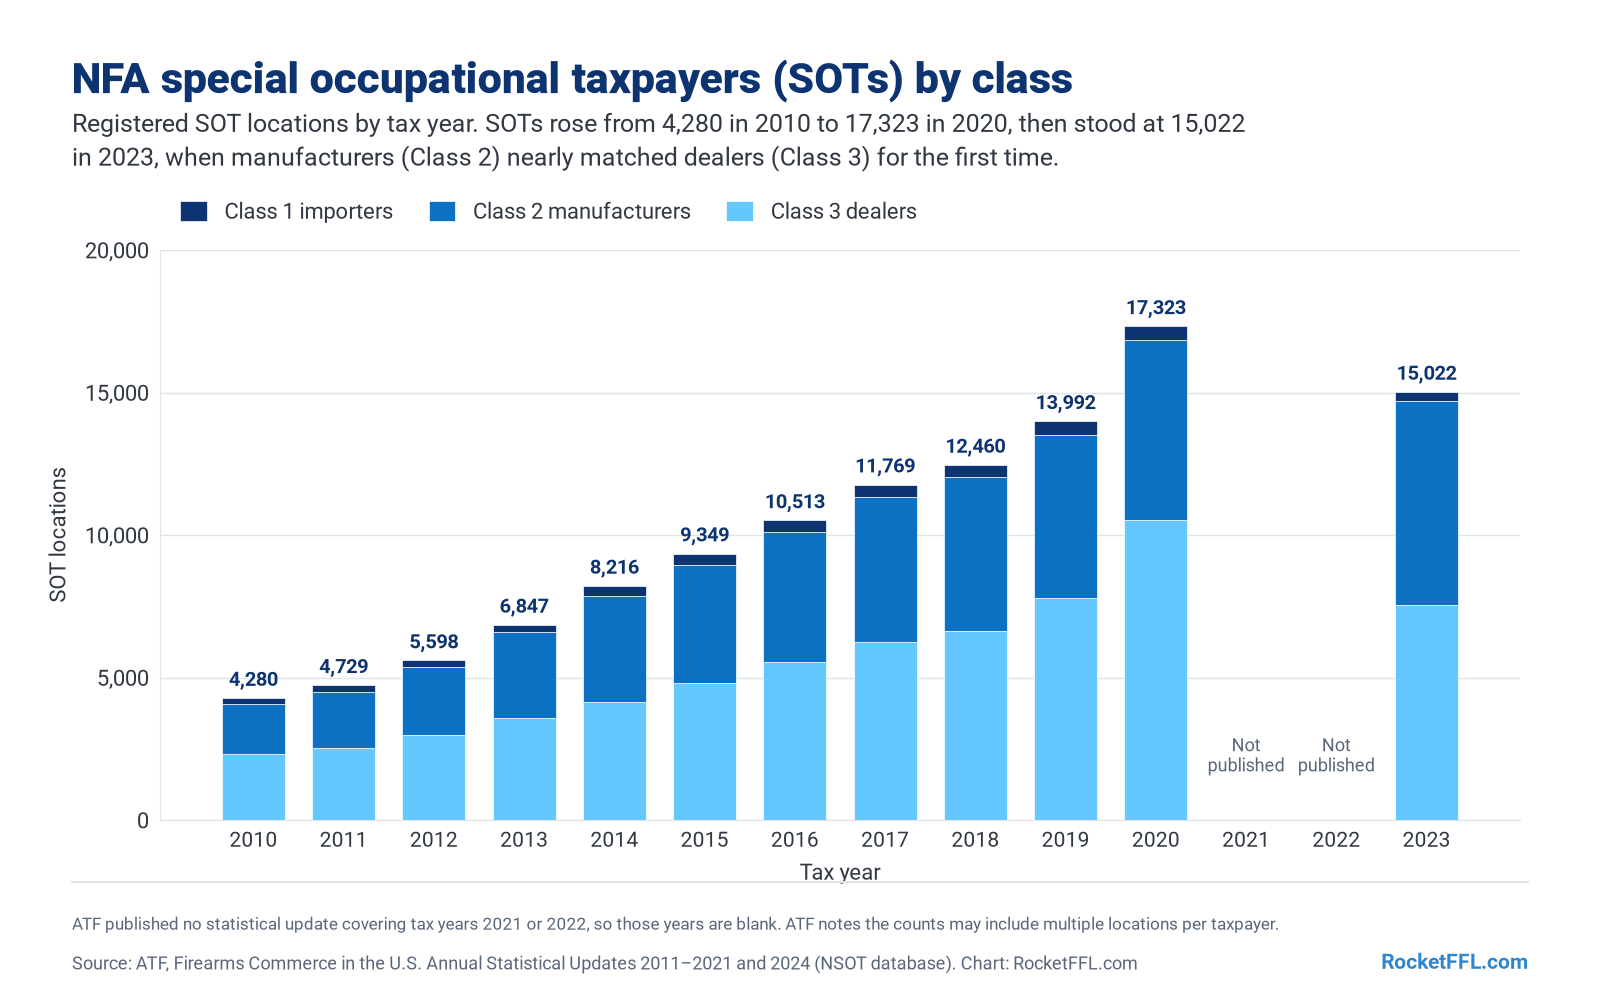
SOTs more than quadrupled in a decade, from 4,280 in tax year 2010 to 17,323 in 2020. The 2023 total of 15,022 was lower, mostly because Class 3 dealers fell from 10,537 to 7,560, while Class 2 manufacturers kept growing (6,310 to 7,146). That fits what we see: many new licensees choose a Type 07 FFL with a Class 2 SOT, which lets them manufacture NFA items and also deal in them.
ATF collected $10,797,263 in special occupational tax in FY2025 and $10,438,289 in FY2024.
Number of SOTs by State
Texas has the most SOTs by far (1,921), followed by Florida (1,154) and Arizona (772). California, which has the most FFLs overall, had just 179 SOTs in tax year 2023.
| Rank | State | Class 1 | Class 2 | Class 3 | Total SOTs |
|---|---|---|---|---|---|
| 1 | Texas | 21 | 929 | 971 | 1,921 |
| 2 | Florida | 51 | 547 | 556 | 1,154 |
| 3 | Arizona | 20 | 481 | 271 | 772 |
| 4 | North Carolina | 5 | 283 | 326 | 614 |
| 5 | Pennsylvania | 17 | 266 | 327 | 610 |
| 6 | Ohio | 7 | 264 | 267 | 538 |
| 7 | Georgia | 14 | 236 | 284 | 534 |
| 8 | Virginia | 24 | 185 | 245 | 454 |
| 9 | Colorado | 6 | 211 | 229 | 446 |
| 10 | Tennessee | 4 | 188 | 235 | 427 |
| 11 | Michigan | 5 | 155 | 230 | 390 |
| 12 | Missouri | 10 | 163 | 206 | 379 |
| 13 | Utah | 8 | 184 | 127 | 319 |
| 14 | Alabama | 9 | 142 | 161 | 312 |
| 15 | Indiana | 2 | 129 | 180 | 311 |
Top 15 states by NFA special occupational taxpayers, tax year 2023 (U.S. total 15,022). Source: ATF Firearms Commerce in the United States 2024, Exhibit 11. CSV download (all states).
3. NFA Registered Weapons and Forms
Every machinegun, short-barreled rifle (SBR), short-barreled shotgun (SBS), silencer, destructive device (DD), and "any other weapon" (AOW) that is lawfully possessed in the U.S. has to be registered in ATF's National Firearms Registration and Transfer Record (NFRTR). SOTs register what they make or import on Form 2, and individuals and trusts apply on Form 1 (to make) or Form 4 (to buy).
Beginning January 1, 2026, the $200 making and transfer tax dropped to $0 for silencers, SBRs, SBSs, and AOWs under Public Law 119-21. Machineguns and destructive devices are still taxed at $200, and registration, approval, and background checks still apply to everything. (See ATF's May 8, 2026 final rule.)
NFA Registered Weapons by Type
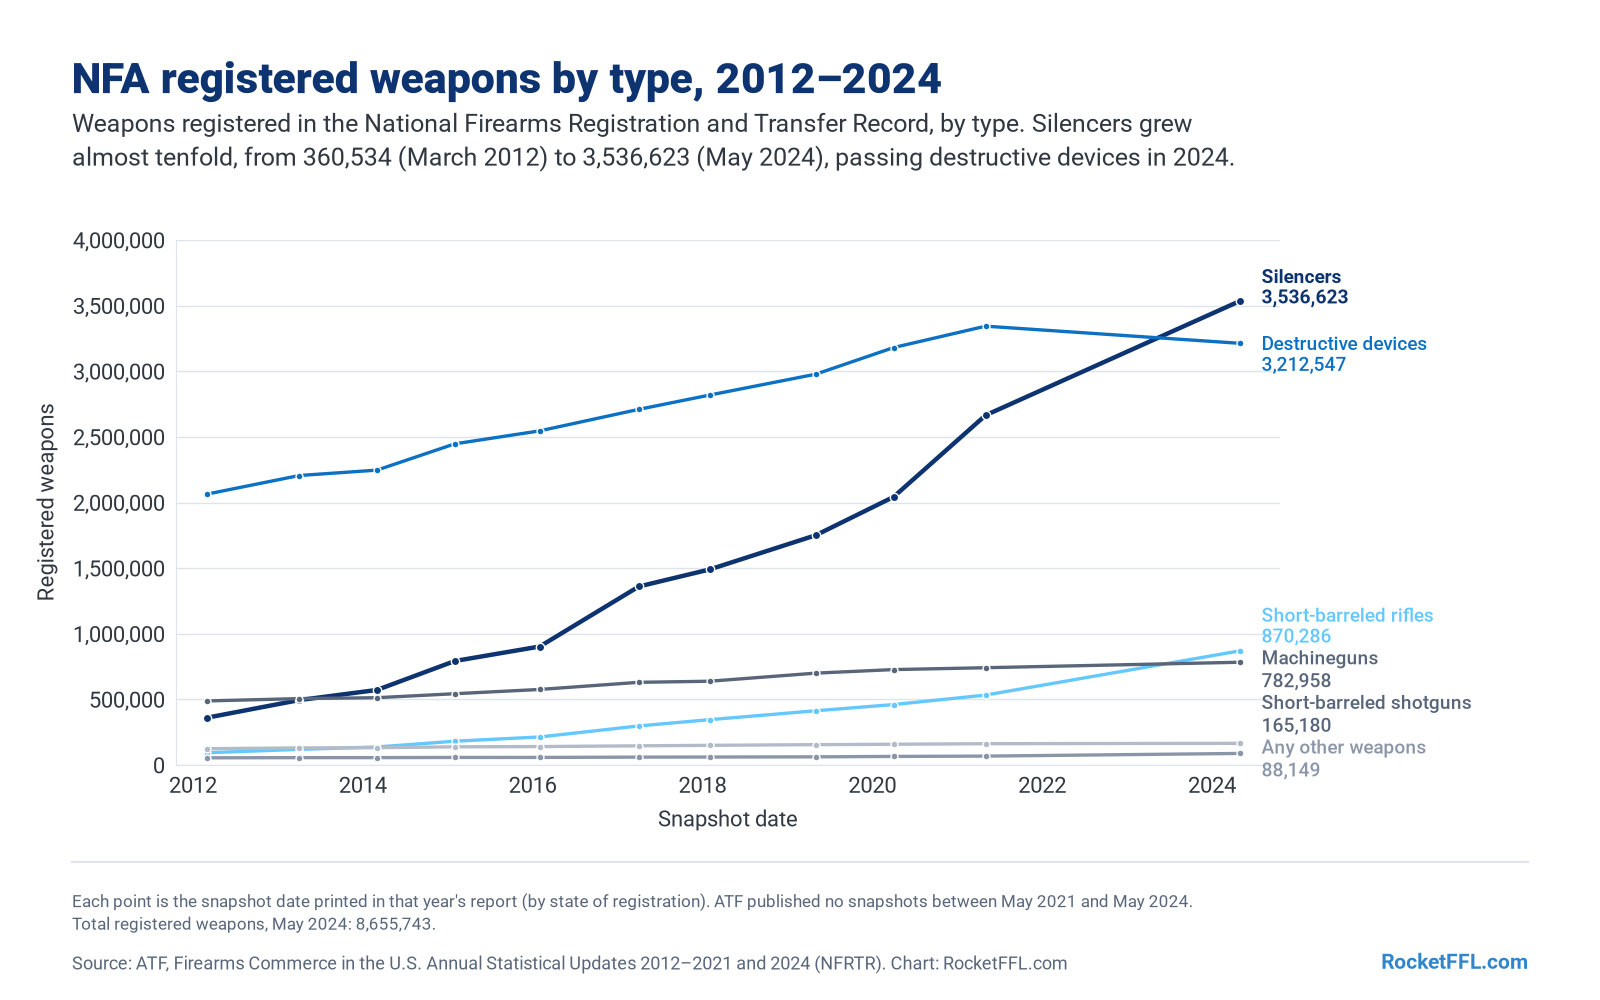
| Type | Mar. 2012 | May 2021 | May 2024 | Aug. 4, 2026 (NFRTR, excl. destroyed/exported/voided) |
|---|---|---|---|---|
| Silencers | 360,534 | 2,664,774 | 3,536,623 | 6,654,209 |
| Destructive devices | 2,064,091 | 3,343,519 | 3,212,547 | not published |
| Short-barreled rifles | 93,486 | 532,725 | 870,286 | 1,227,044 |
| Machineguns | 488,065 | 741,146 | 782,958 | not published |
| Short-barreled shotguns | 124,079 | 162,267 | 165,180 | 208,674 |
| Any other weapons | 54,649 | 67,744 | 88,149 | 96,869 |
| Total | 3,184,804 | 7,512,175 | 8,655,743 | not published |
Weapons registered in the NFRTR by type. 2012–2024: ATF Firearms Commerce in the United States (registered weapons by state exhibits, snapshot dates as printed). August 2026: ATF Current Processing Times page, which uses a different basis (it excludes destroyed, exported, and voided firearms) and lists only four types, so it isn't directly comparable. ATF's printed 2012 total (3,184,804) is 100 lower than the sum of its own columns (3,184,904); we show the printed total. CSV download.
How many machineguns can civilians own? ATF reports that, as of June 2025, the NFRTR held approximately 2,382,403 machineguns in total, including those registered to government agencies, dealer sales samples, exported guns, and non-functional war trophies. Of those, approximately 234,718 were registered as transferable to or between private individuals (the pre-1986 guns allowed under 18 U.S.C. § 922(o)). Source: ATF Data & Statistics.
NFA Registered Weapons by State
Texas has more NFA-registered weapons (1,136,732) than any other state, including 599,133 silencers. Florida (631,809) and Virginia (479,582) are next. These are registrations by the state recorded in the NFRTR, including weapons held by manufacturers, importers, and dealers, not just individuals.
| Rank | State | Silencers | Short-barreled rifles | Machineguns | Destructive devices | Total NFA weapons |
|---|---|---|---|---|---|---|
| 1 | Texas | 599,133 | 122,052 | 50,170 | 348,794 | 1,136,732 |
| 2 | Florida | 245,647 | 83,657 | 46,811 | 240,273 | 631,809 |
| 3 | Virginia | 114,167 | 38,304 | 46,392 | 267,149 | 479,582 |
| 4 | California | 18,484 | 19,201 | 26,335 | 334,883 | 418,971 |
| 5 | Georgia | 177,211 | 36,866 | 50,188 | 99,631 | 377,800 |
| 6 | Arkansas | 114,447 | 40,002 | 18,204 | 118,385 | 308,973 |
| 7 | Pennsylvania | 117,806 | 40,285 | 21,604 | 99,299 | 295,474 |
| 8 | North Carolina | 112,666 | 32,250 | 15,663 | 86,650 | 252,362 |
| 9 | Ohio | 94,121 | 27,121 | 22,627 | 92,845 | 245,758 |
| 10 | Indiana | 87,431 | 18,672 | 23,342 | 82,764 | 226,280 |
Top 10 states by NFA-registered weapons, May 2024 (U.S. total 8,655,743). State is the state descriptor in the NFRTR. Source: ATF Firearms Commerce in the United States 2024, Exhibit 10. CSV download (all states and all six types).
NFA Forms Processed
NFA paperwork has exploded. ATF processed 41,579 NFA forms in FY2005 and a record 1,507,443 in FY2025, about 36 times as many. And that was before the $0 tax took effect. In calendar year 2026 through August 5, ATF received 1,874,895 NFA forms, including 1,092,729 Form 4s and 202,599 Form 1s (ATF Current Processing Times).
| Fiscal year | NFA forms processed | NFA firearms processed | Applications received | Making & transfer tax collected |
|---|---|---|---|---|
| 2025 | 1,507,443 | 5,817,780 | 1,445,407 | $177,114,166 |
| 2024 | 1,373,305 | 4,731,918 | 1,170,028 | $145,072,242 |
| 2023 | 1,069,787 | 3,571,938 | n/a | about $96.0 million |
| 2022 | 709,508 | 3,059,054 | n/a | about $91.5 million |
| 2021 | 546,224 | 2,731,716 | n/a | about $78.6 million |
| 2020 | 512,315 | 2,353,436 | n/a | about $51.7 million |
| 2019 | 342,860 | 1,949,822 | n/a | about $37.3 million |
| 2015 | 308,563 | 1,426,211 | n/a | about $32.5 million |
| 2010 | 91,949 | 828,462 | n/a | n/a |
| 2005 | 41,579 | 147,484 | n/a | n/a |
NFA forms and firearms processed by ATF's NFA Division, by fiscal year. Applications received are published only for FY2024–FY2025. Tax figures for FY2013–FY2023 are rounded by ATF. Sources: ATF Data & Statistics (NFA section, updated May 18, 2026); ATF Facts and Figures FY2024 and FY2025. CSV download (FY2005–FY2025); firearms processed by form type, 2013–2023.
NFA and FFL Processing Times
Wait times have fallen dramatically since the days of 8- to 12-month Form 4 approvals. Even with the 2026 surge, ATF reported an average of 9 days for individual Form 4 eForms and 33 days for trust Form 4 eForms finalized in July 2026. Form 1 eForms averaged 57 days. ATF's times change monthly, so check the source for the current figures.
| Form | What it's for | eForm average | Paper average |
|---|---|---|---|
| Form 4 Individual | Application for Tax Paid Transfer and Registration of Firearm | 9 days | 28 days |
| Form 4 Trust | Application for Tax Paid Transfer and Registration of Firearm | 33 days | 34 days |
| Form 1 | Application to Make and Register a Firearm | 57 days | 38 days |
| Form 3 | Application for Tax-Exempt Transfer of Firearm and Registration to Special Occupational Taxpayer (SOT) | 1 day | 7 days |
| Form 5 | Application for Tax-Exempt Transfer and Registration of Firearm | 1 day | 6 days |
| Form 2 | Notice of Firearms Manufactured or Imported | 1 day | 6 days |
| Form 20 | Application to Transport Interstate or to Temporarily Export Certain National Firearms Act (NFA) Firearms | 2 days | 7 days |
| Form 7 | Application for Federal Firearms License (FFL) | n/a | 60 days |
Average processing times for applications finalized in July 2026 (page last updated Aug. 27, 2026). In July 2026 ATF received 225,231 NFA applications and finalized 254,639; the median individual eForm 4 took 8 days. Source: ATF Current Processing Times. CSV download (all forms); 2026 NFA application activity.
GET YOUR SOT COURSE
Want to Make or Sell Suppressors and Other NFA Items?
Learn how to pair your FFL with the right SOT class, pay the special occupational tax, and handle NFA paperwork the right way.
- Attorney-created
- Lifetime access
- Updated as things change
4. ATF Inspections
ATF industry operations investigators (IOIs) conduct compliance inspections of FFLs to make sure they are following federal law and keeping the required records (like the acquisition and disposition book and Forms 4473). An inspection can end with no violations, a report of violations, a warning letter, a warning conference, or a recommendation to revoke the license. A revocation recommendation isn't a revocation: the licensee gets notice and can request a hearing before a final decision.
ATF completed 8,472 firearms compliance inspections in FY2025, down from 9,696 in FY2024. That works out to about 6.6% of all FFLs, or 10.9% of business licenses. Inspections peaked at 22,330 in FY1993 and dropped to 5,827 in FY2020, during the COVID-19 pandemic.
Number of ATF Compliance Inspections
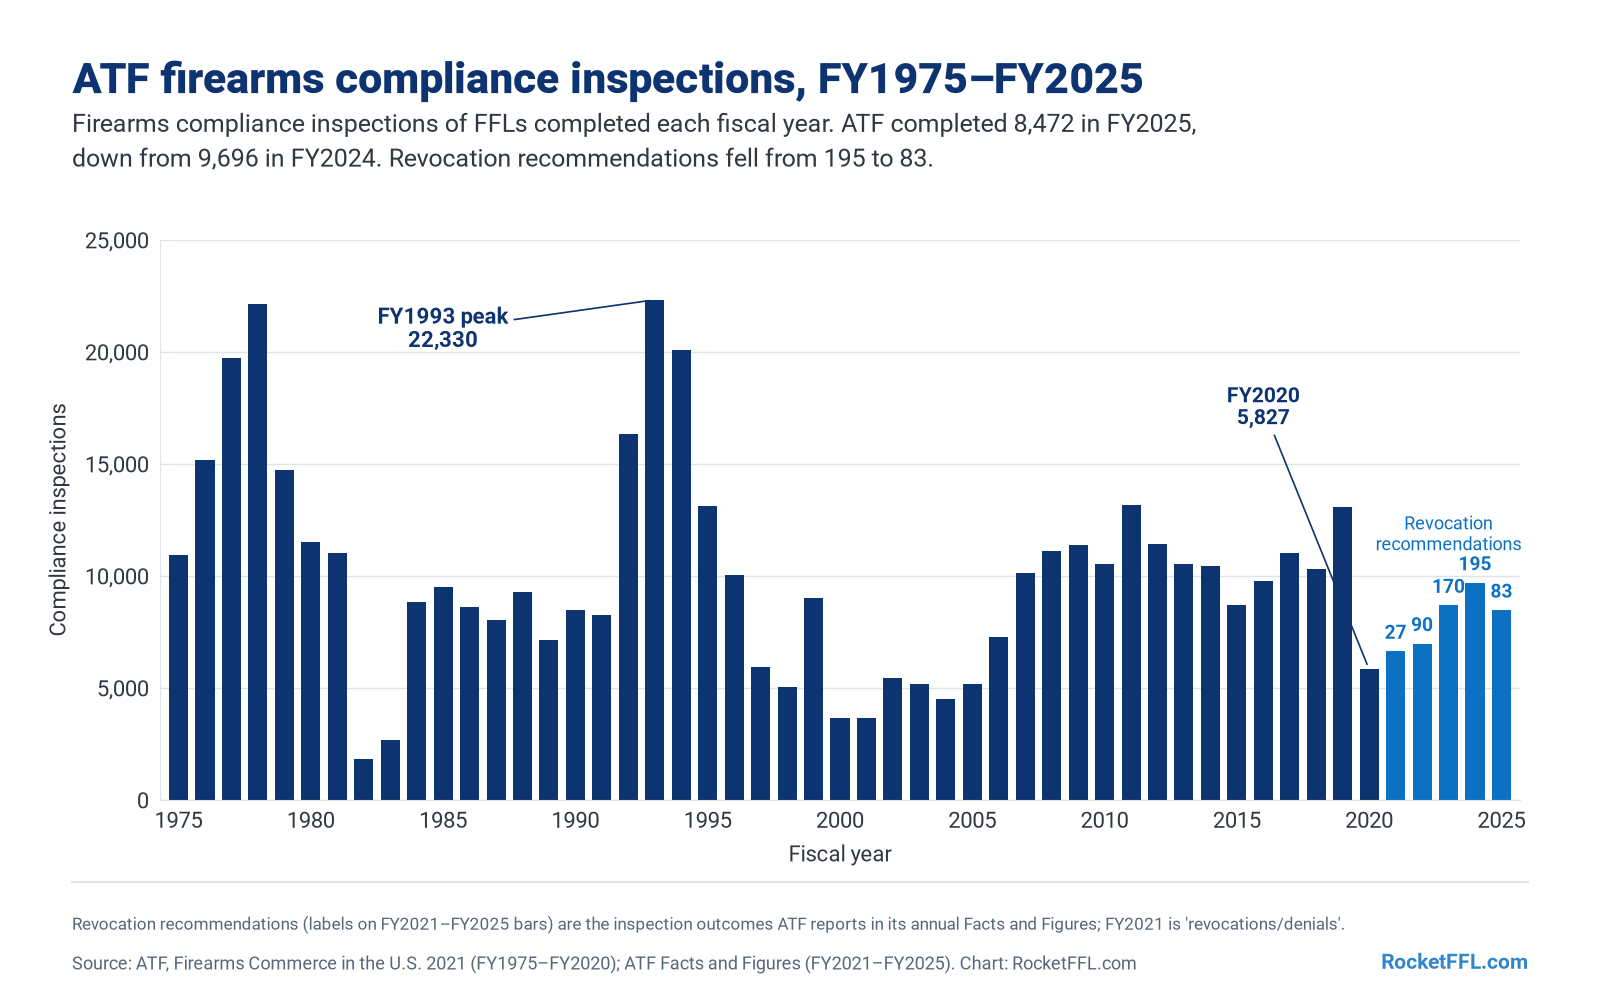
| Fiscal year | Compliance inspections | Active FFLs | % of FFLs inspected | % of business FFLs inspected |
|---|---|---|---|---|
| 2025 | 8,472 | 127,739 | 6.6% | 10.9% |
| 2024 | 9,696 | 128,690 | 7.5% | 12.3% |
| 2023 | 8,689 | 132,383 | 6.6% | 10.7% |
| 2022 | 6,979 | 134,811 | 5.2% | 8.5% |
| 2021 | 6,639 | 134,809 | 4.9% | 8.2% |
| 2020 | 5,827 | 130,605 | 4.5% | 7.5% |
| 2019 | 13,079 | 130,546 | 10.0% | 16.7% |
| 2018 | 10,323 | 134,191 | 7.7% | 12.9% |
| 2017 | 11,009 | 136,081 | 8.1% | 13.7% |
| 2016 | 9,790 | 137,464 | 7.1% | 12.2% |
| 2015 | 8,696 | 139,840 | 6.3% | 11.0% |
ATF firearms compliance inspections of FFLs by fiscal year. Percentages are calculated by RocketFFL (inspections ÷ active FFLs; business FFLs exclude Type 03). Sources: ATF Firearms Commerce in the United States 2021 (FY2015–FY2020); ATF Facts and Figures (FY2021–FY2025). CSV download (FY1975–FY2025).
Inspection Results, Violations, and Revocations
In FY2025, 54.3% of compliance inspections found no violations, and 33.8% ended with a violation-based outcome (a report of violations, warning letter, warning conference, or revocation recommendation). Another 881 licensees surrendered their license or were found out of business. ATF recommended revocation after 83 inspections (1.0%), down from 195 (2.0%) in FY2024 and 170 in FY2023. Those were the full fiscal years under ATF's 2021 "zero tolerance" Enhanced Regulatory Enforcement Policy, which DOJ and ATF repealed on April 7, 2025, about halfway through FY2025.
ATF also reported that it completed 8 firearm administrative revocation assignments in FY2025, 6 of which resulted in license revocation and 2 in other dispositions (a separate count from the inspection recommendations above).
| Result | FY2025 | FY2024 | FY2023 | FY2022 | FY2021 |
|---|---|---|---|---|---|
| No violations | 4,604 | 5,207 | 4,644 | 3,806 | 4,232 |
| Report of violations | 1,553 | 1,689 | 1,531 | n/a | 985 |
| Warning letter | 677 | 721 | 667 | 606 | 454 |
| Warning conference | 547 | 214 | 166 | 131 | 149 |
| License surrendered / out of business | 881 | 1,488 | 1,343 | n/a | 789 |
| Revocation recommended | 83 | 195 | 170 | 90 | 27 |
| Other dispositions | 127 | 182 | 168 | n/a | 3 |
| Total inspections | 8,472 | 9,696 | 8,689 | 6,979 | 6,639 |
| % with no violations | 54.3% | 53.7% | 53.4% | 54.5% | 63.7% |
| % with a violation outcome* | 33.8% | 29.1% | 29.2% | n/a | 24.3% |
| % revocation recommended | 1.0% | 2.0% | 2.0% | 1.3% | 0.4% |
Results of ATF firearms compliance inspections as reported in ATF's annual Facts and Figures. *Report of violations, warning letter, warning conference, or revocation recommended. FY2022: only partial results are available (as quoted in DOJ's FY2024 ATF budget request); n/a = not available. FY2021: ATF labeled the surrender row "Discontinued" and the revocation row "Revocations/Denials." FY2023 figures are from ATF's FY2023 fact sheet as indexed by search engines (the page wasn't retrievable directly). CSV download.
Most Common Violations (FY2025)
| Rank | Regulation | Violation | Times cited |
|---|---|---|---|
| 1 | 27 CFR 478.125(e) | Failure to maintain an accurate/complete/timely acquisition and disposition record of firearms | 40,763 |
| 2 | 27 CFR 478.21(a) | Failure to complete forms as prescribed | 31,006 |
| 3 | 27 CFR 478.124(c)(1) | Failure to obtain a completed ATF F 4473 | 23,415 |
| 4 | 27 CFR 478.124(c)(3)(iv) | Failure to record NICS contact information on an ATF F 4473 | 14,776 |
| 5 | 27 CFR 478.124(c)(5) | Failure by transferor to sign and/or date an ATF F 4473 | 10,336 |
| 6 | 27 CFR 478.124(c)(3)(i) | Failure to verify or record Identification document on ATF F 4473 | 7,134 |
| 7 | 27 CFR 478.123(b) | Failure to maintain an accurate/complete/timely licensee disposition record | 7,028 |
| 8 | 27 CFR 478.126a | Failure to report multiple sales or other dispositions of pistols and revolvers | 6,608 |
| 9 | 27 CFR 478.123(a) | Failure to maintain an accurate/complete/timely manufacture or acquisition record | 5,719 |
| 10 | 27 CFR 478.124(c)(4) | Failure to record firearm information on an ATF F 4473 | 5,637 |
Top 10 firearms violations cited in ATF compliance inspections, FY2025. One inspection can produce many citations. Source: ATF Facts and Figures, FY2025. CSV download.
The most common violations are recordkeeping errors: incomplete or late entries in the acquisition and disposition record and mistakes on Forms 4473. All ten are paperwork problems that a well-trained licensee can avoid, which is why getting your recordkeeping right from day one matters so much.
Methodology
- Fiscal years: ATF license and inspection counts are for federal fiscal years, which end September 30. "FY2025" means October 1, 2024 through September 30, 2025, and license counts are the active licenses at the end of the year.
- Which source we use for each year: FY1975–FY2023 license counts come from ATF's Firearms Commerce in the United States reports (2021 and 2024 editions). FY2024 and FY2025 come from ATF's Facts and Figures fact sheets. ATF's documents don't always agree: for FY2021, the Commerce report shows 134,809 FFLs while ATF's FY2021 fact sheet showed 136,846. We use the Commerce figure for consistency with the rest of the series.
- FFLs by state: From ATF's monthly "Report of Active Firearms Licenses – License Type by State Statistics." March 2026 (printed March 10, 2026) is the most recent month ATF has published; later monthly listings weren't available on ATF's site when we checked in September 2026. The state report total (127,161) is a monthly snapshot, so it differs from the FY2025 year-end count (127,739). Pending applications are listed separately and not counted as licenses. We publish counts only, never individual licensee names or addresses.
- Per-capita rates: RocketFFL divided each state's March 2026 FFL count by its July 1, 2025 resident population from the U.S. Census Bureau's Vintage 2025 estimates. The overall rate (37.2) covers the 50 states and D.C.
- SOTs: Special occupational taxpayer counts come from ATF's NSOT database as published in the Commerce reports, by July–June tax year. ATF says the counts may include multiple locations per taxpayer. ATF's 2024 report jumped from tax year 2020 to 2023, so tax years 2021 and 2022 are not available.
- NFA registered weapons: The 2012–2024 figures are the NFRTR "registered weapons by state" tables in each Commerce report, as of the date printed in each edition. The August 2026 figures from ATF's processing-times page exclude destroyed, exported, and voided firearms and cover only four types, so they aren't directly comparable. ATF's printed 2012 total (3,184,804) is 100 lower than the sum of its own columns (3,184,904); we show the printed total and flag it in the CSV.
- Inspections: Counts and results are from ATF's annual Facts and Figures (FY2021–FY2025) and the 2021 Commerce report (FY1975–FY2020). FY2023 results come from ATF's FY2023 fact sheet as indexed by search engines because ATF's page blocked direct retrieval; FY2022 results are partial and come from DOJ's FY2024 ATF budget request, which quotes the FY2022 fact sheet. ATF also publishes monthly inspection spreadsheets; adding them up gives slightly different totals (for example, 9,710 inspections and 195 revocation recommendations for FY2024), so we use the annual fact-sheet numbers.
- What a "revocation" number means: "Revocation recommended" is an inspection outcome, not a final revocation. Final revocations can take months, can be settled or reversed after a hearing, and are counted separately (ATF reported 8 administrative revocation assignments completed in FY2025, with 6 revocations).
- Nothing is estimated: Every number on this page is published by ATF or the Census Bureau, or calculated by us from those numbers (percentages, per-capita rates, changes). If ATF hasn't published a figure, we say so.
Sources and CSV Downloads
- ATF Fact Sheet: Facts and Figures for Fiscal Year 2025 and Fiscal Year 2024 (licenses by type, inspections, results, violations, application inspections)
- ATF, Firearms Commerce in the United States: Annual Statistical Update 2024 (PDF) and 2021 edition (PDF) (FFLs by type and state, SOTs, NFA registry, applications, inspections)
- ATF, Listing of Federal Firearms Licensees: Report of Active Firearms Licenses – License Type by State Statistics, March 2026 (PDF)
- ATF Data & Statistics (NFA forms and firearms processed, tax collected, machinegun counts)
- ATF Current Processing Times (July 2026 averages, 2026 NFA activity, August 2026 NFRTR counts)
- ATF monthly FFL compliance inspection results (used to cross-check annual totals)
- U.S. Census Bureau, Vintage 2025 state population estimates (CSV)
- DOJ, FY2024 ATF budget request (PDF) (FY2022 inspection results) and ATF final rule on NFA tax changes (May 8, 2026)
Download the data (CSV): every file lists the ATF or Census source for each row. Free to use with attribution to RocketFFL and ATF.
- FFLs by type, FY1975–FY2025 (ffls-by-type-by-fiscal-year-1975-2025.csv)
- FFLs by state and type, March 2026, with population and per-capita rates (ffls-by-state-march-2026.csv)
- FFL applications processed, denied, withdrawn, and application inspections (ffl-application-actions-fy1975-2025.csv)
- SOTs by class, tax years 2010–2023 (sots-by-class-by-tax-year.csv)
- SOTs by state, tax year 2023 (sots-by-state-tax-year-2023.csv)
- NFA registered weapons by type, 2012–2026 (nfa-registered-weapons-by-type-2012-2026.csv)
- NFA registered weapons by state and type, May 2024 (nfa-registered-weapons-by-state-may-2024.csv)
- NFA forms and firearms processed, FY2005–FY2025 (nfa-forms-and-firearms-processed-by-fiscal-year-2005-2025.csv)
- NFA firearms processed by form type, 2013–2023 (nfa-firearms-processed-by-form-type-2013-2023.csv)
- NFA application activity, July 2026 and 2026 year to date (nfa-application-activity-2026.csv)
- ATF application processing times, July 2026 (atf-application-processing-times-july-2026.csv)
- ATF firearms compliance inspections, FY1975–FY2025 (atf-firearms-compliance-inspections-fy1975-2025.csv)
- ATF inspection results, FY2021–FY2025 (atf-inspection-outcomes-fy2021-2025.csv)
- Top 10 firearms violations cited, FY2025 (atf-top-firearms-violations-fy2025.csv)
Cite This Page
Suggested citation: RocketFFL, "ATF / FFL Statistics: Federal Firearms Licenses, SOTs, NFA Registrations and ATF Inspections," based on ATF Facts and Figures, Firearms Commerce in the United States, and Federal Firearms Licensee listing data, updated September 24, 2026, https://rocketffl.com/atf-ffl-statistics/
Journalists and researchers: you're welcome to use these numbers and charts. Please credit RocketFFL and link to this page. Questions about the data or the law behind it? Contact us (press page) and Ryan Cleckner, a firearms attorney, can help.
Frequently Asked Questions
How many FFLs are there in the United States?
There were 127,739 active federal firearms licenses at the end of fiscal year 2025 (September 30, 2025), according to ATF. That includes 49,984 Type 03 collector licenses, so about 77,755 were business licenses such as dealers, pawnbrokers, manufacturers, and importers.
What is the most common type of FFL?
The Type 03 collector of curios and relics license (49,984 in FY2025) is the most common, but it doesn't allow a firearms business. Among business licenses, the Type 01 dealer license is most common (46,072), followed by the Type 07 manufacturer license (21,367).
Which state has the most FFLs?
California had the most active FFLs in ATF's March 2026 report (12,291), followed by Texas (10,407) and Florida (7,024). But 10,223 of California's are collector licenses. Texas has the most business FFLs (8,277). Per person, Wyoming leads with 162.4 FFLs per 100,000 residents.
How many FFLs were there at the peak?
The number of FFLs peaked at 284,117 in fiscal year 1992. It fell to about 103,000 by 2000 after federal changes in the early 1990s made it harder to hold a home-based or 'kitchen-table' license, and it has been between about 103,000 and 141,000 ever since.
How many SOTs are there?
ATF counted 15,022 special occupational taxpayers in tax year 2023, the latest year it has published: 316 Class 1 importers, 7,146 Class 2 manufacturers, and 7,560 Class 3 dealers. The peak was 17,323 in 2020.
How many NFA firearms are registered in the U.S.?
ATF reported 8,655,743 weapons registered in the National Firearms Registration and Transfer Record as of May 2024, including 3,536,623 silencers, 3,212,547 destructive devices, 870,286 short-barreled rifles, and 782,958 machineguns. As of August 4, 2026, ATF counted 6,654,209 registered silencers (excluding destroyed, exported, and voided records).
How long does ATF take to approve an FFL or a Form 4?
For applications finalized in July 2026, ATF reported an average of 60 days for a Form 7 FFL application, 9 days for an individual Form 4 eForm (median 8 days), 33 days for a trust Form 4 eForm, and 57 days for a Form 1 eForm. These change monthly.
How often does ATF inspect FFLs?
ATF completed 8,472 firearms compliance inspections in FY2025, about 6.6% of all FFLs (or 10.9% of business licenses). ATF doesn't inspect every licensee every year.
How many FFLs does ATF revoke?
In FY2025, ATF recommended revocation after 83 of 8,472 compliance inspections (1.0%), down from 195 in FY2024. ATF separately reported completing 8 administrative revocation cases in FY2025, 6 of which ended in revocation. 54.3% of inspections found no violations.
More from RocketFFL
Want the manufacturing side of the industry? Our U.S. firearms industry statistics page tracks how many guns are made in America, by whom, and where.
Thinking about getting your own FFL? Most new licensees today run a home-based business, and a Type 07 FFL (manufacturing plus dealing) is often the best place to start. Our Get Your FFL course walks you through choosing the right license, setting up your business, and getting through the ATF interview, step by step. Want to deal in or make NFA items like suppressors and short-barreled rifles? Our SOT course explains how to become a special occupational taxpayer and stay compliant.
GET YOUR FFL COURSE
Start Your FFL Business Compliant From Day One
Most inspection violations are recordkeeping mistakes. Our course shows you how to get licensed and set up your records the right way before ATF ever shows up.
- Attorney-created
- Lifetime access
- Updated as things change